R in 3 Months Week 9 (Advanced Data Viz, Part 1)
Agenda
Housekeeping
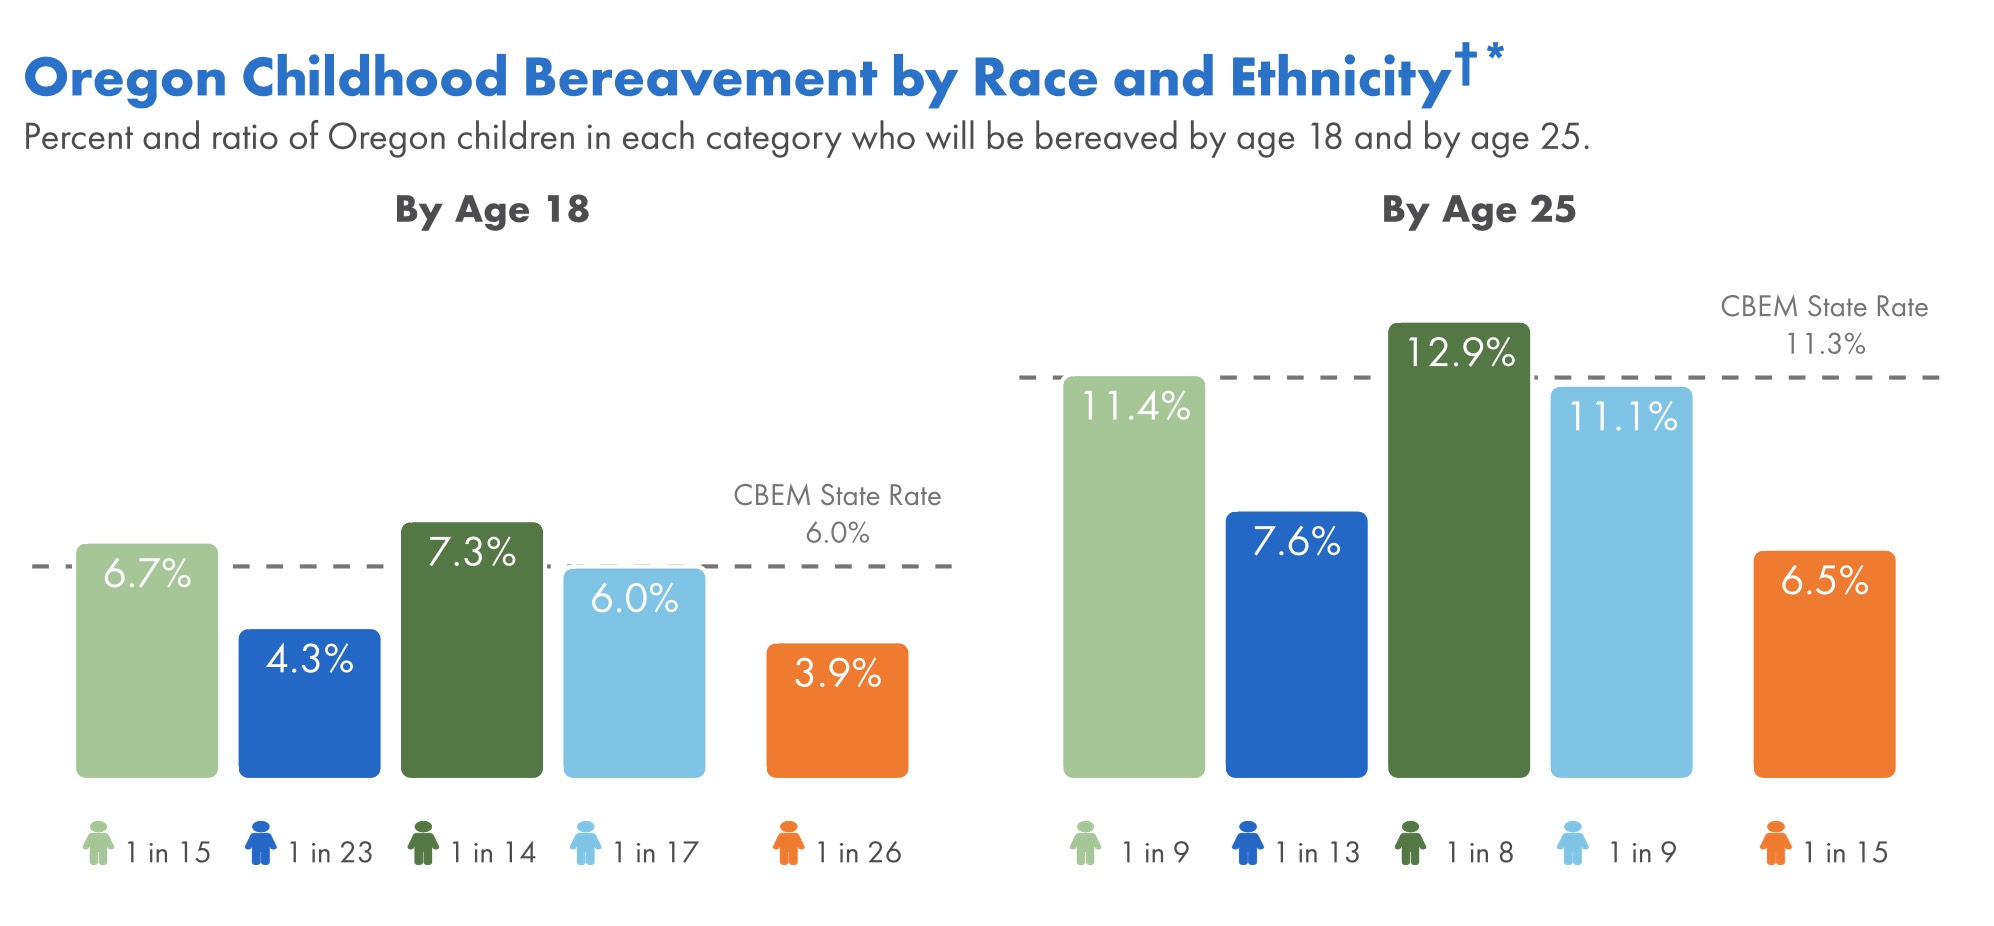
CBEM data viz live coding
Making functions for data viz
Next week
Housekeeping
AI-generated summaries on live session pages
Housekeeping
Remaining weeks:
Week 10: Catch-up week
Week 11: Advanced data viz, part 2 (making your own ggplot theme)
Week 12: Advanced Quarto
Week 13: Final projects
Housekeeping
- You can get feedback from your coach through the end of December
- You have access to materials FOREVER!
Advanced Data Viz
Assessment break
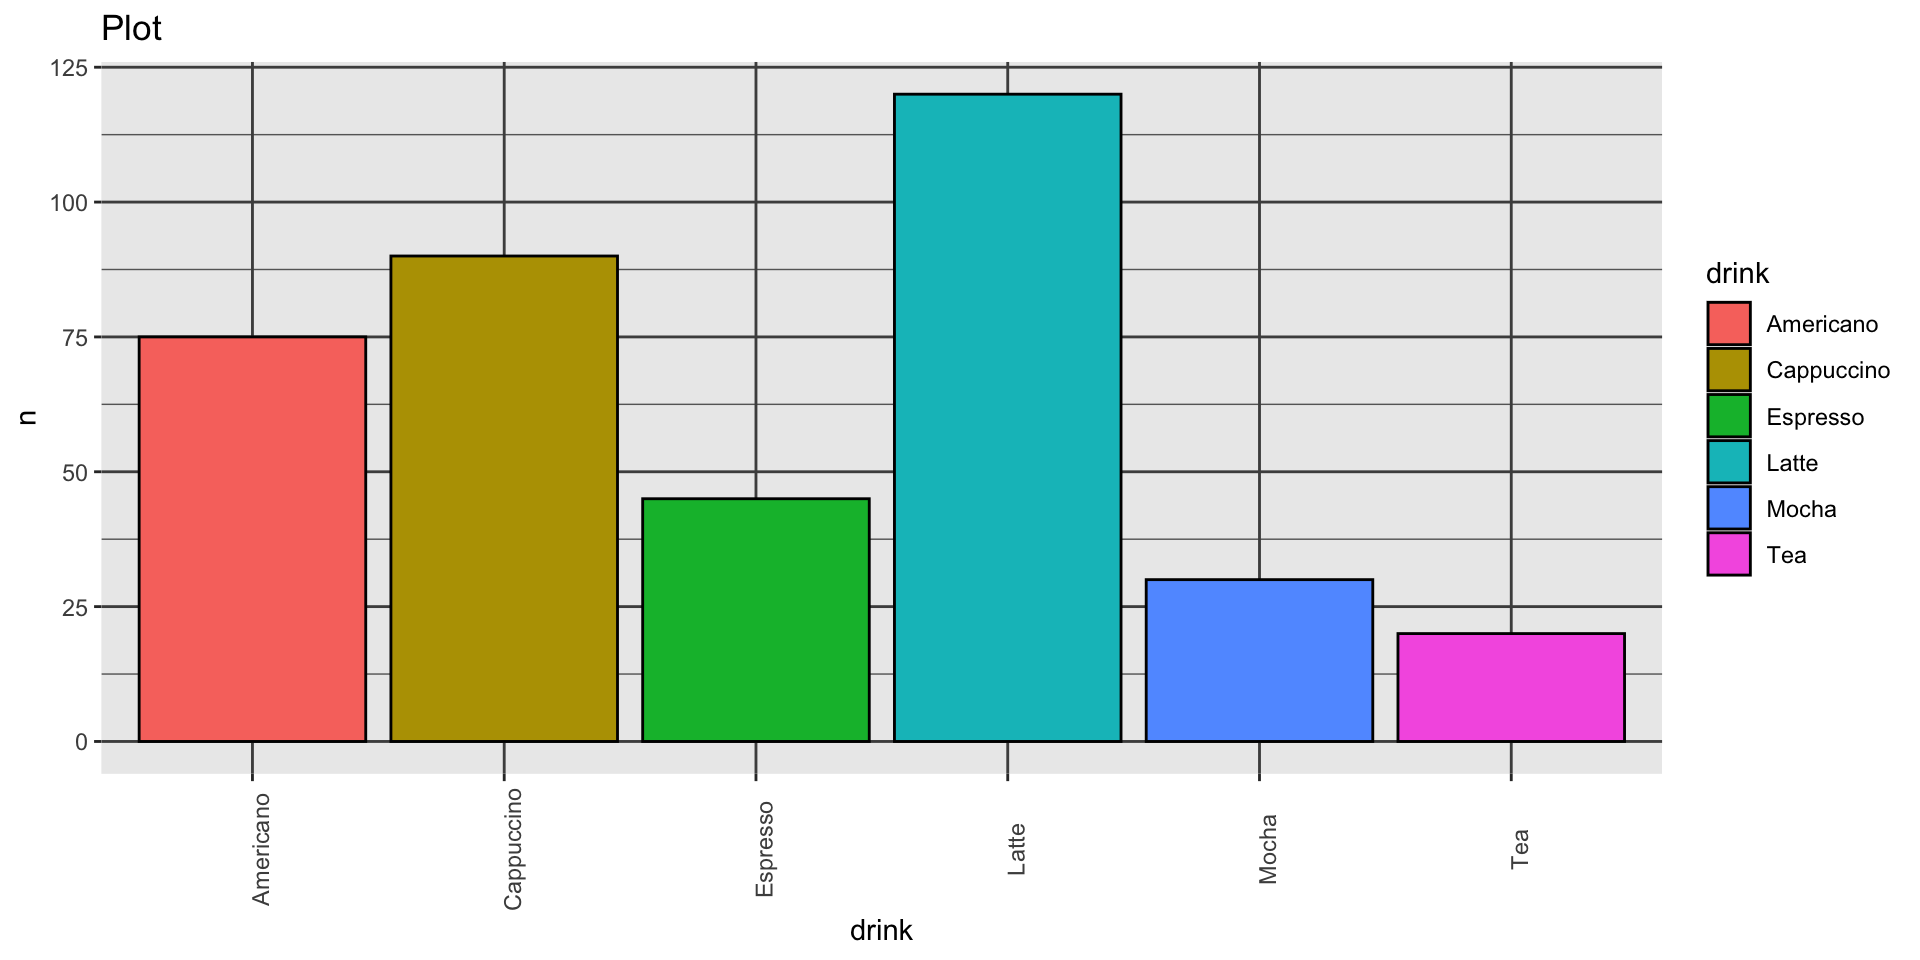
How would you improve this chart? Name as many fixes as you can.
Assessment break
Some possible improvements:
- Reorder the bars by sales with
fct_reorder(), or flip to horizontal bars. - Use color strategically: drop the rainbow fill and highlight one bar (e.g., Latte).
- Declutter: remove the legend, dark gridlines and grey background; no need for rotated labels once the bars are horizontal.
- Label descriptively: replace
nanddrinkwith meaningful axis labels. - Title the finding: e.g., “Lattes outsell every other drink”, aligned to the plot edge.
CBEM Bar Chart Live Coding
Next Week
Catch-up week
Week 11 is more advanced data viz, including making your own custom theme