── Attaching core tidyverse packages ──────────────────────── tidyverse 2.0.0 ──
✔ dplyr     1.1.2     ✔ readr     2.1.4
✔ forcats   1.0.0     ✔ stringr   1.5.0
✔ ggplot2   3.4.3     ✔ tibble    3.2.1
✔ lubridate 1.9.2     ✔ tidyr     1.3.0
✔ purrr     1.0.2
── Conflicts ────────────────────────────────────────── tidyverse_conflicts() ──
✖ dplyr::filter() masks stats::filter()
✖ dplyr::lag()    masks stats::lag()
ℹ Use the conflicted package (<http://conflicted.r-lib.org/>) to force all conflicts to become errors
library(palmerpenguins)
library(nflplotR)

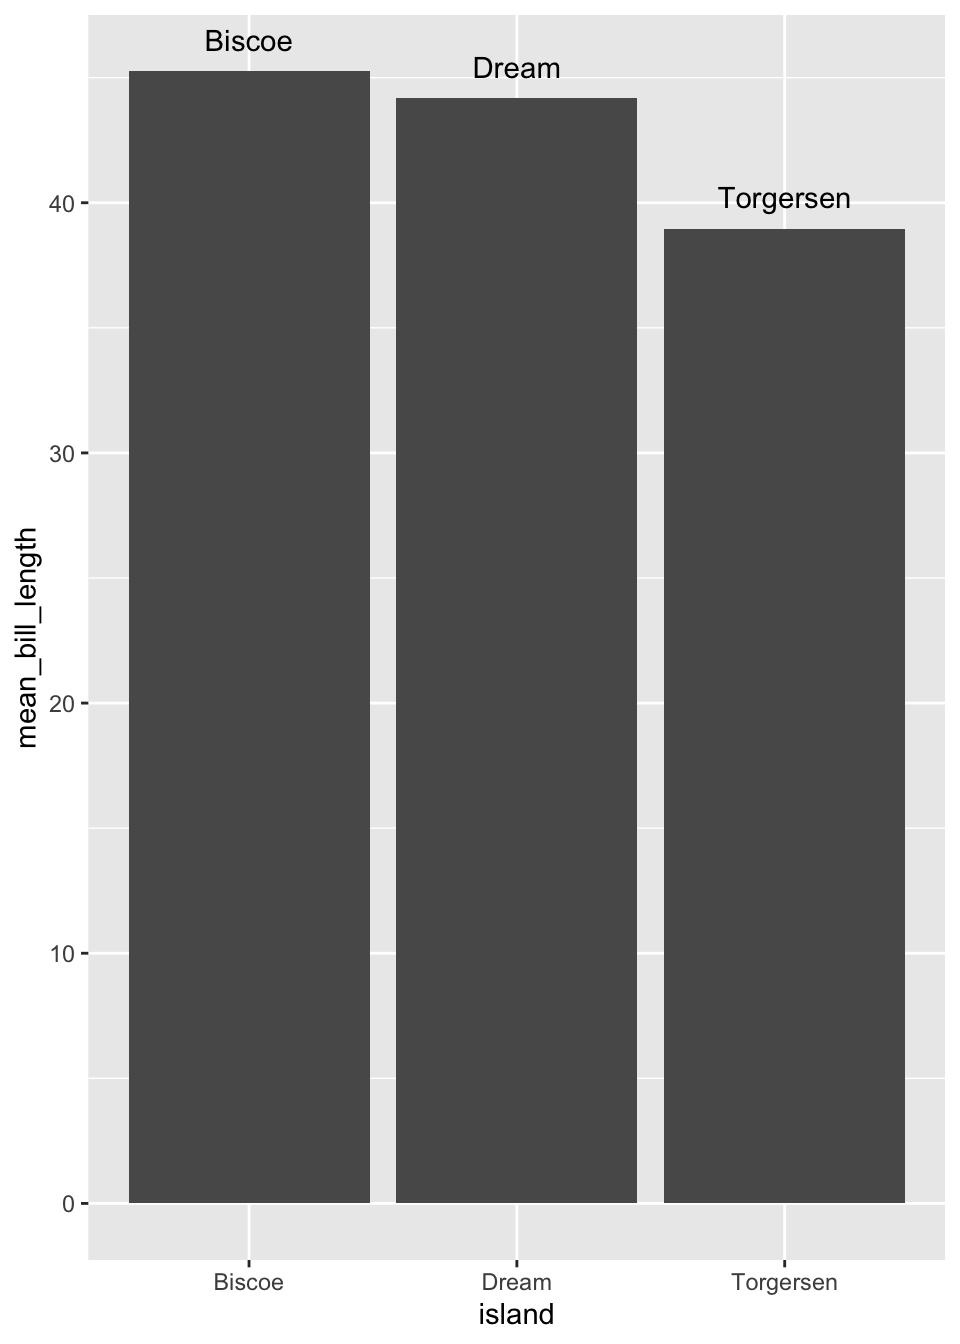
penguins_bill_length_by_island <- penguins |>
  group_by(island) |>
  summarize(mean_bill_length = mean(bill_length_mm, na.rm = TRUE))

ggplot(data = penguins_bill_length_by_island,
       aes(x = island,
           y = mean_bill_length,
           label = island)) +
  geom_col() +
  geom_text(vjust = -1)