Code
penguins |>
  count(island) |>
  ggplot(aes(x = island,
             y = n)) +
  geom_col()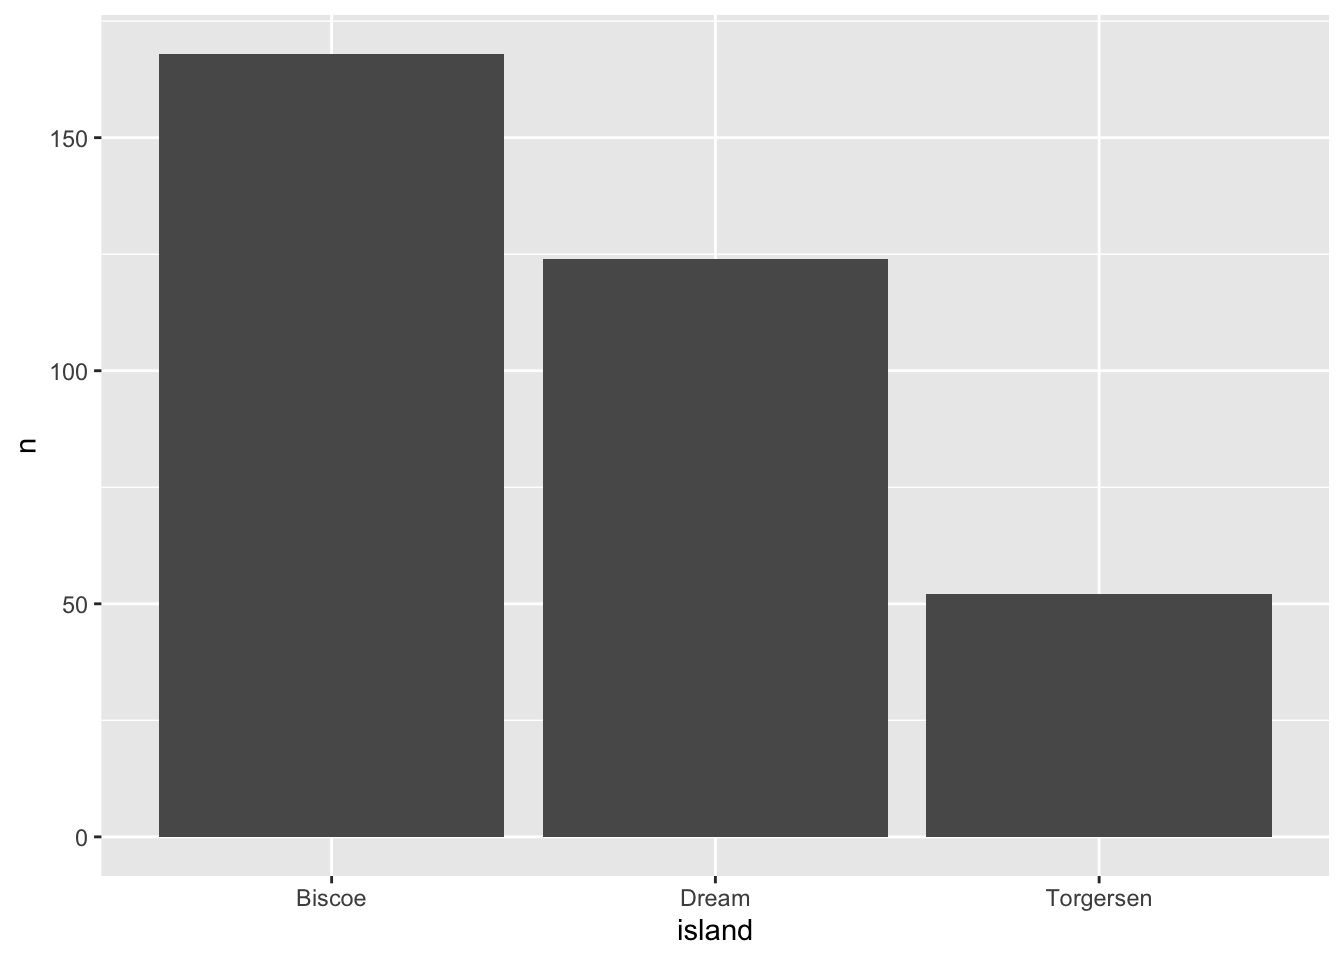
I’m having trouble getting the plot to show below. What do I need to change to make it show up?
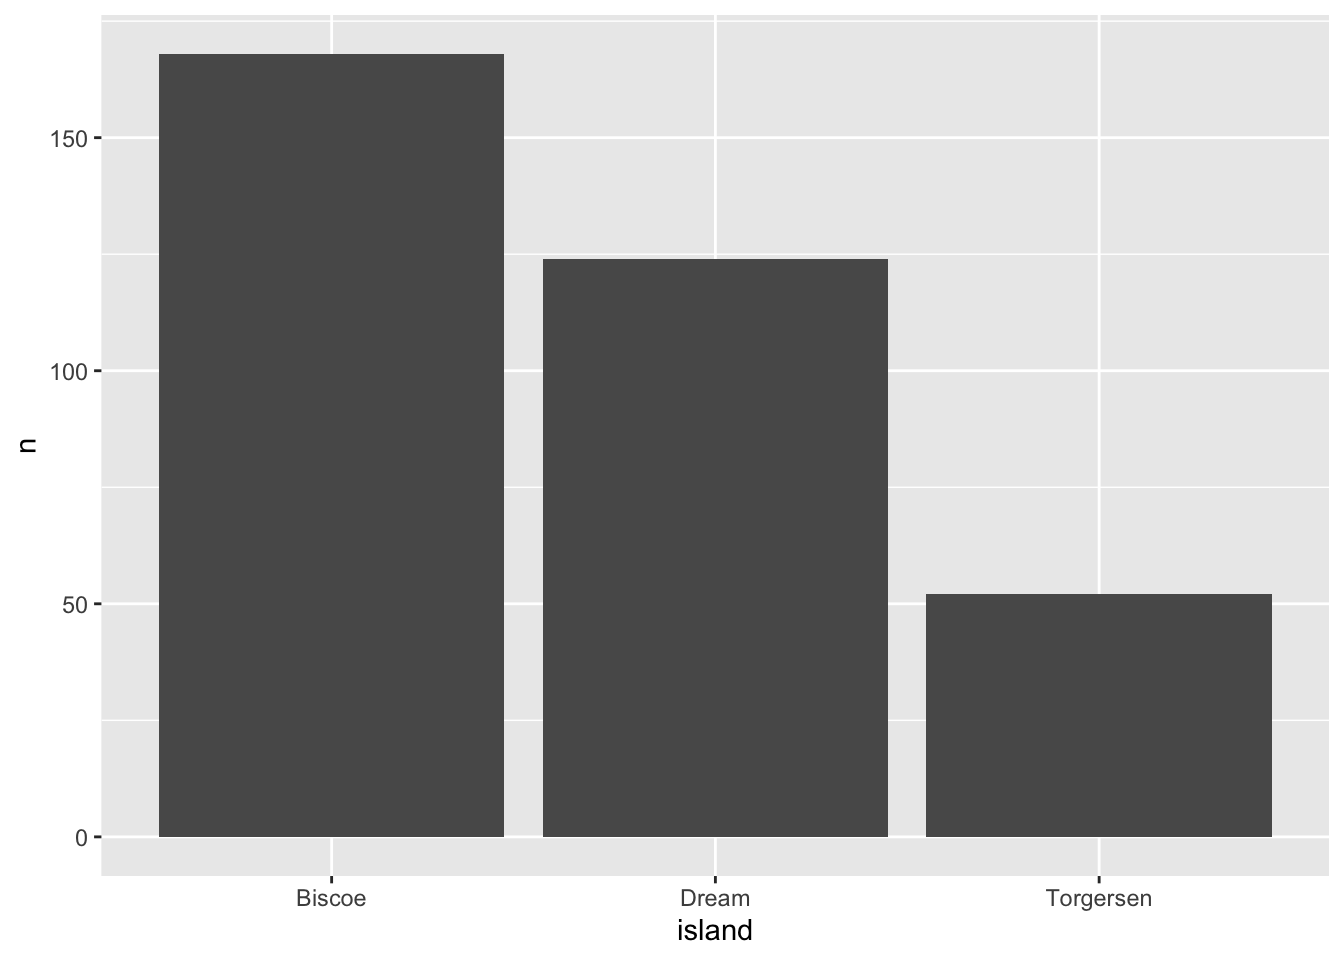
penguins |>
count(island) |>
ggplot(aes(x = island,
y = n)) +
geom_col()
Can you also make a change to hide the code throughout the rendered report?
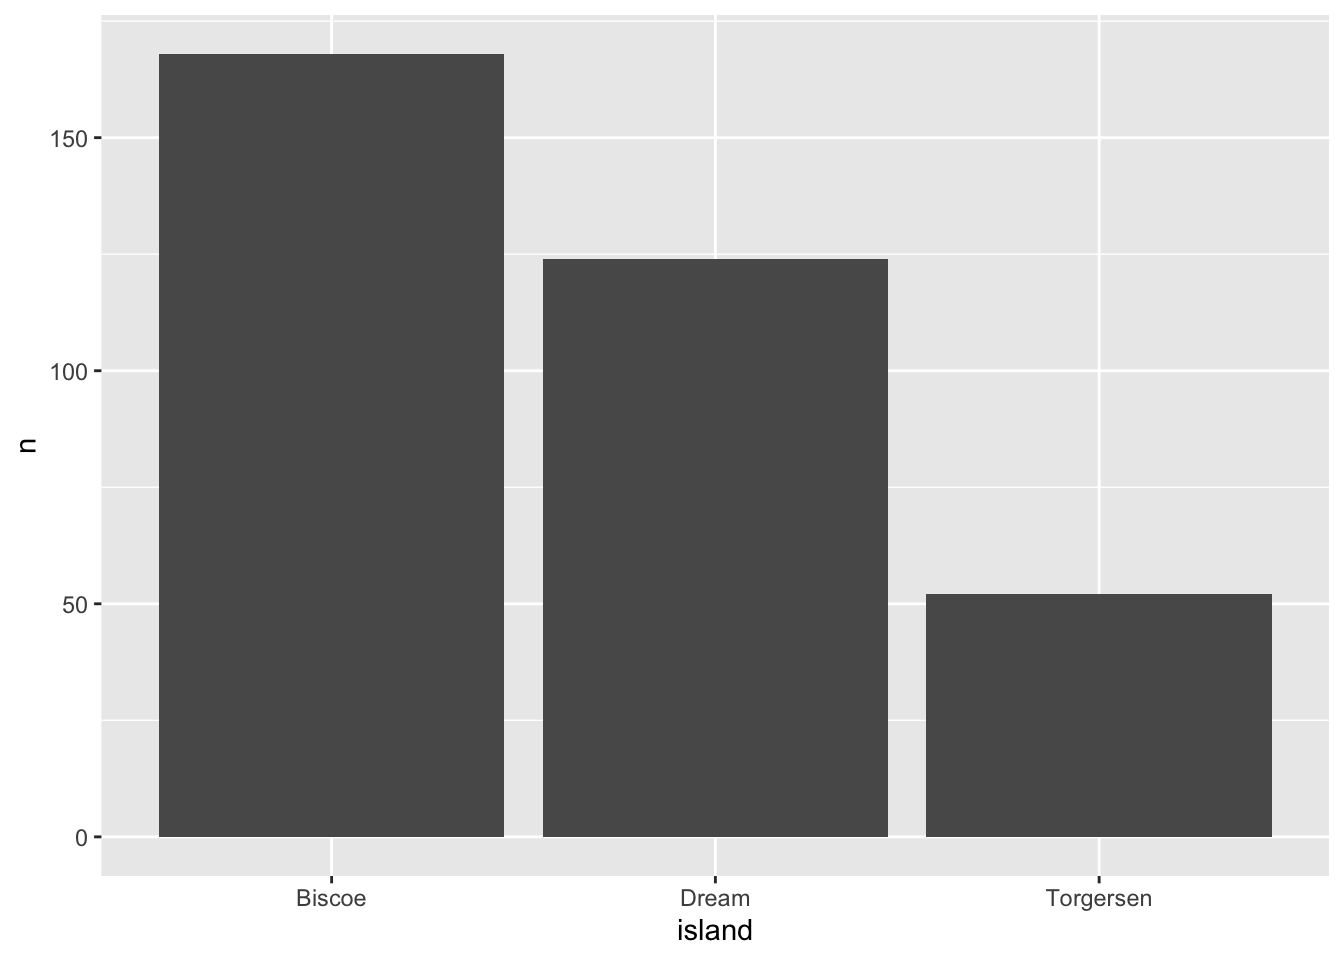
What if you want to hide the code in the first two code chunks, but keep it in the last one? How could you do that?
First list
List item
Second list
List item